Observability for Kubernetes
Unified Kubernetes observability with a federated control plane and OpenTelemetry, reducing data transfer costs by 90%.

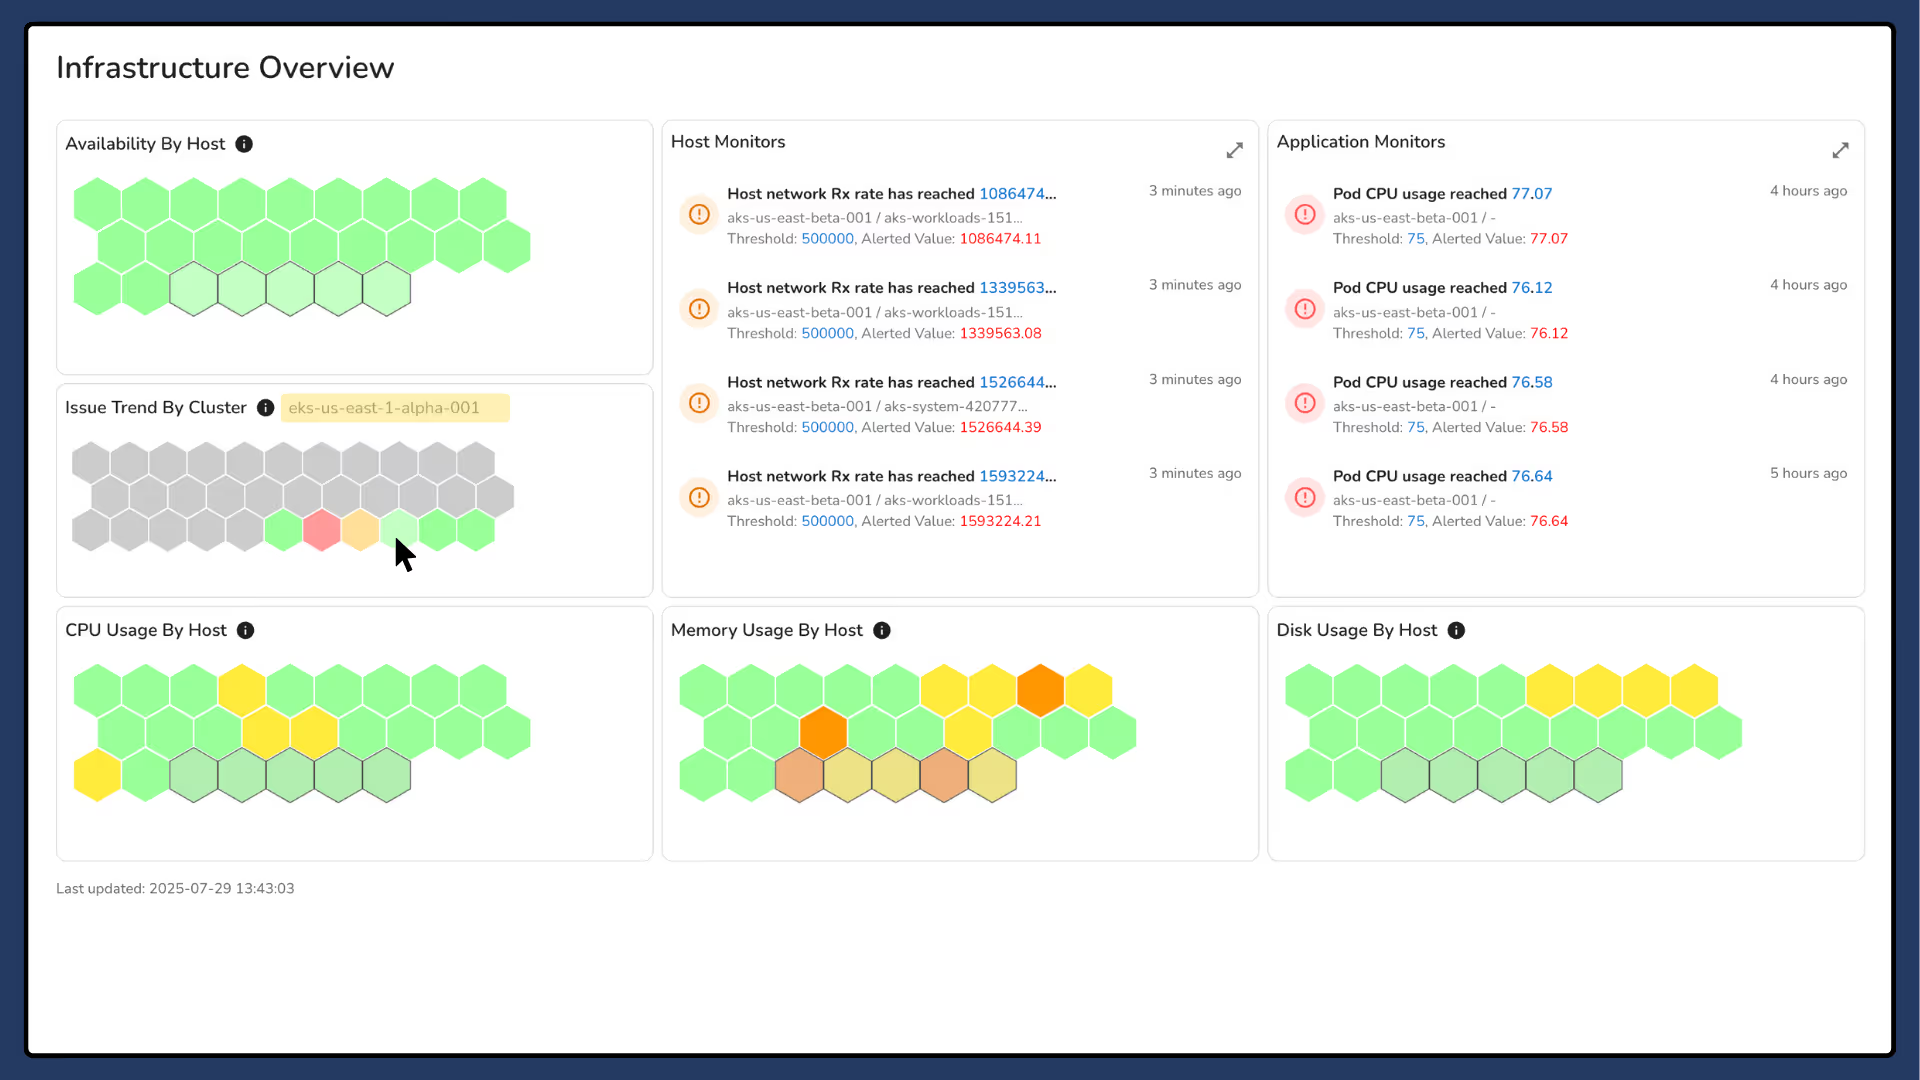
Kubernetes Infrastructure Monitoring
OpenTelemetry-native APM
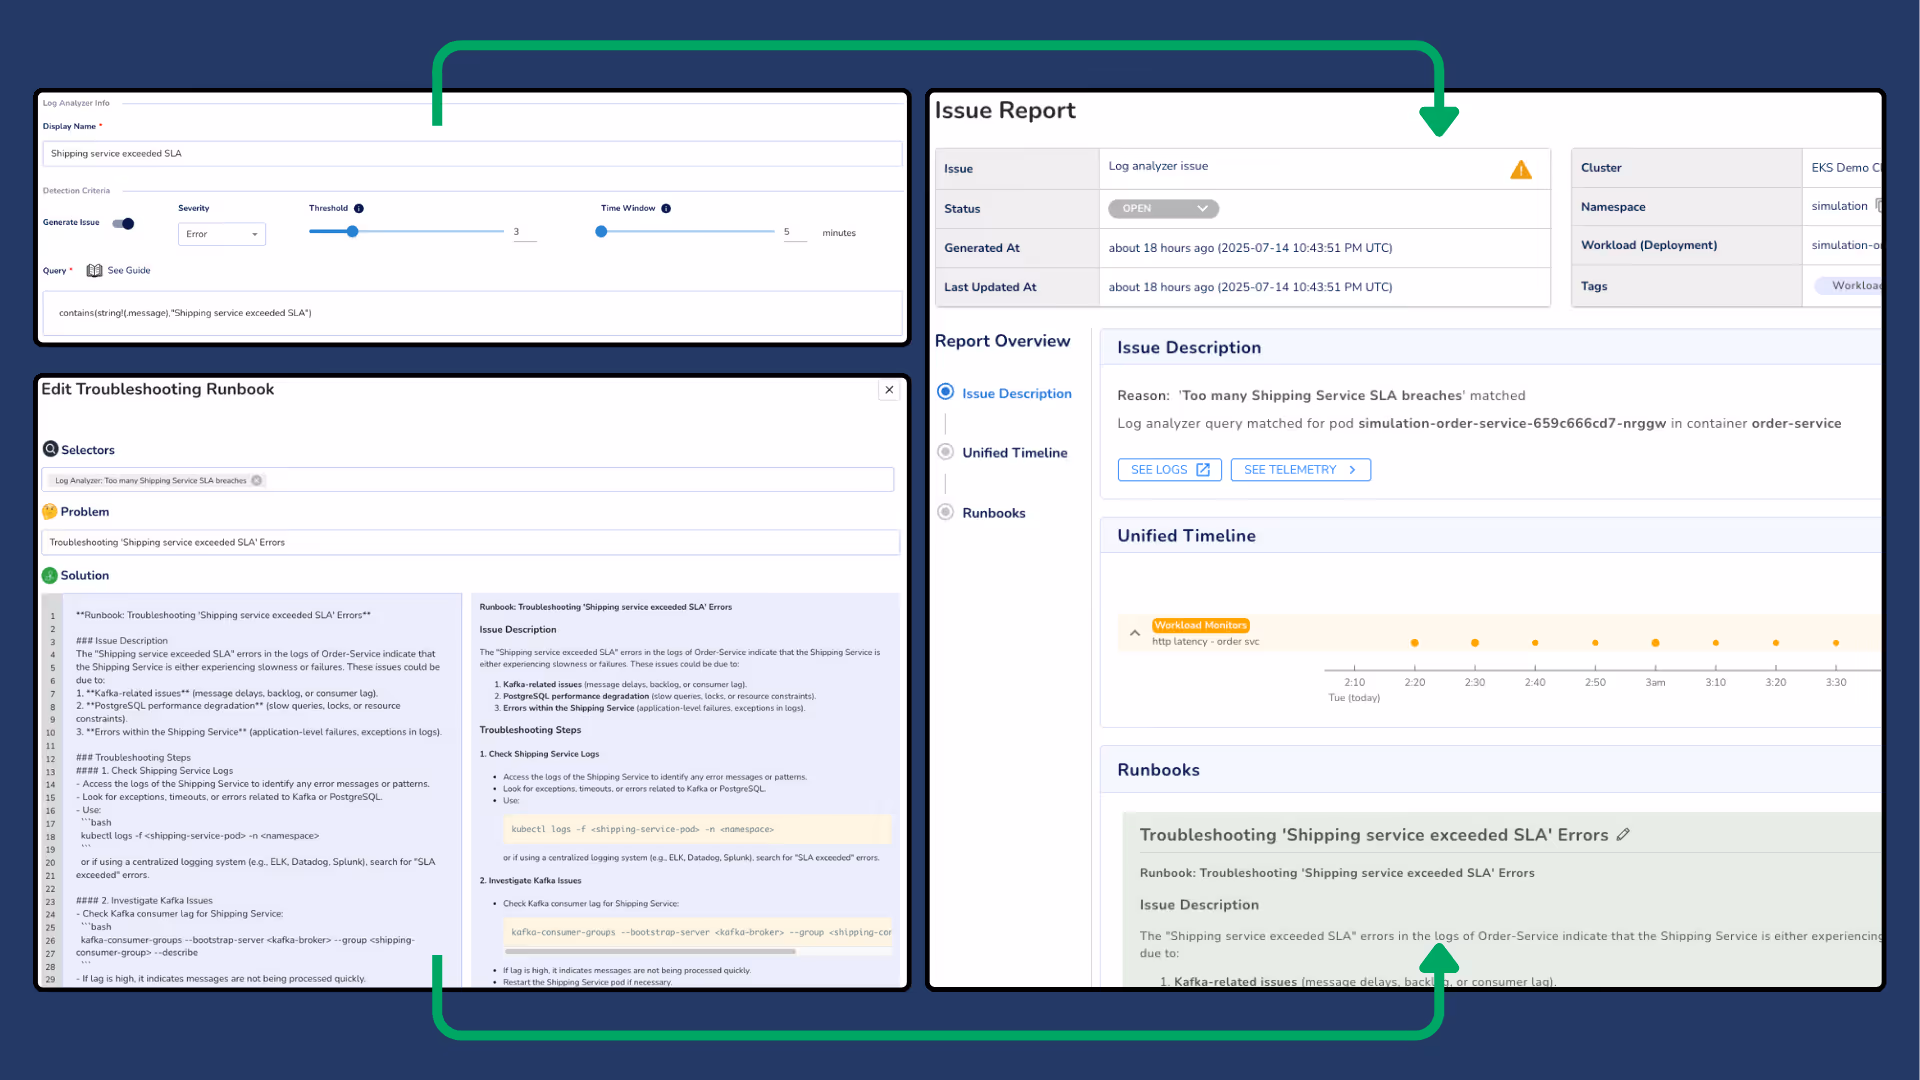
Local log scanning with zero egress
Kubernetes Infrastructure Monitoring
OpenTelemetry-native APM
Local log scanning with zero egress
.png)
Analyze logs in your environment with zero egress costs.

Monitor infra. health by cloud, host, or region in one unified interface
Analyze failing hosts or resource spikes with detailed context
Proactively detect issues in host health with monitors
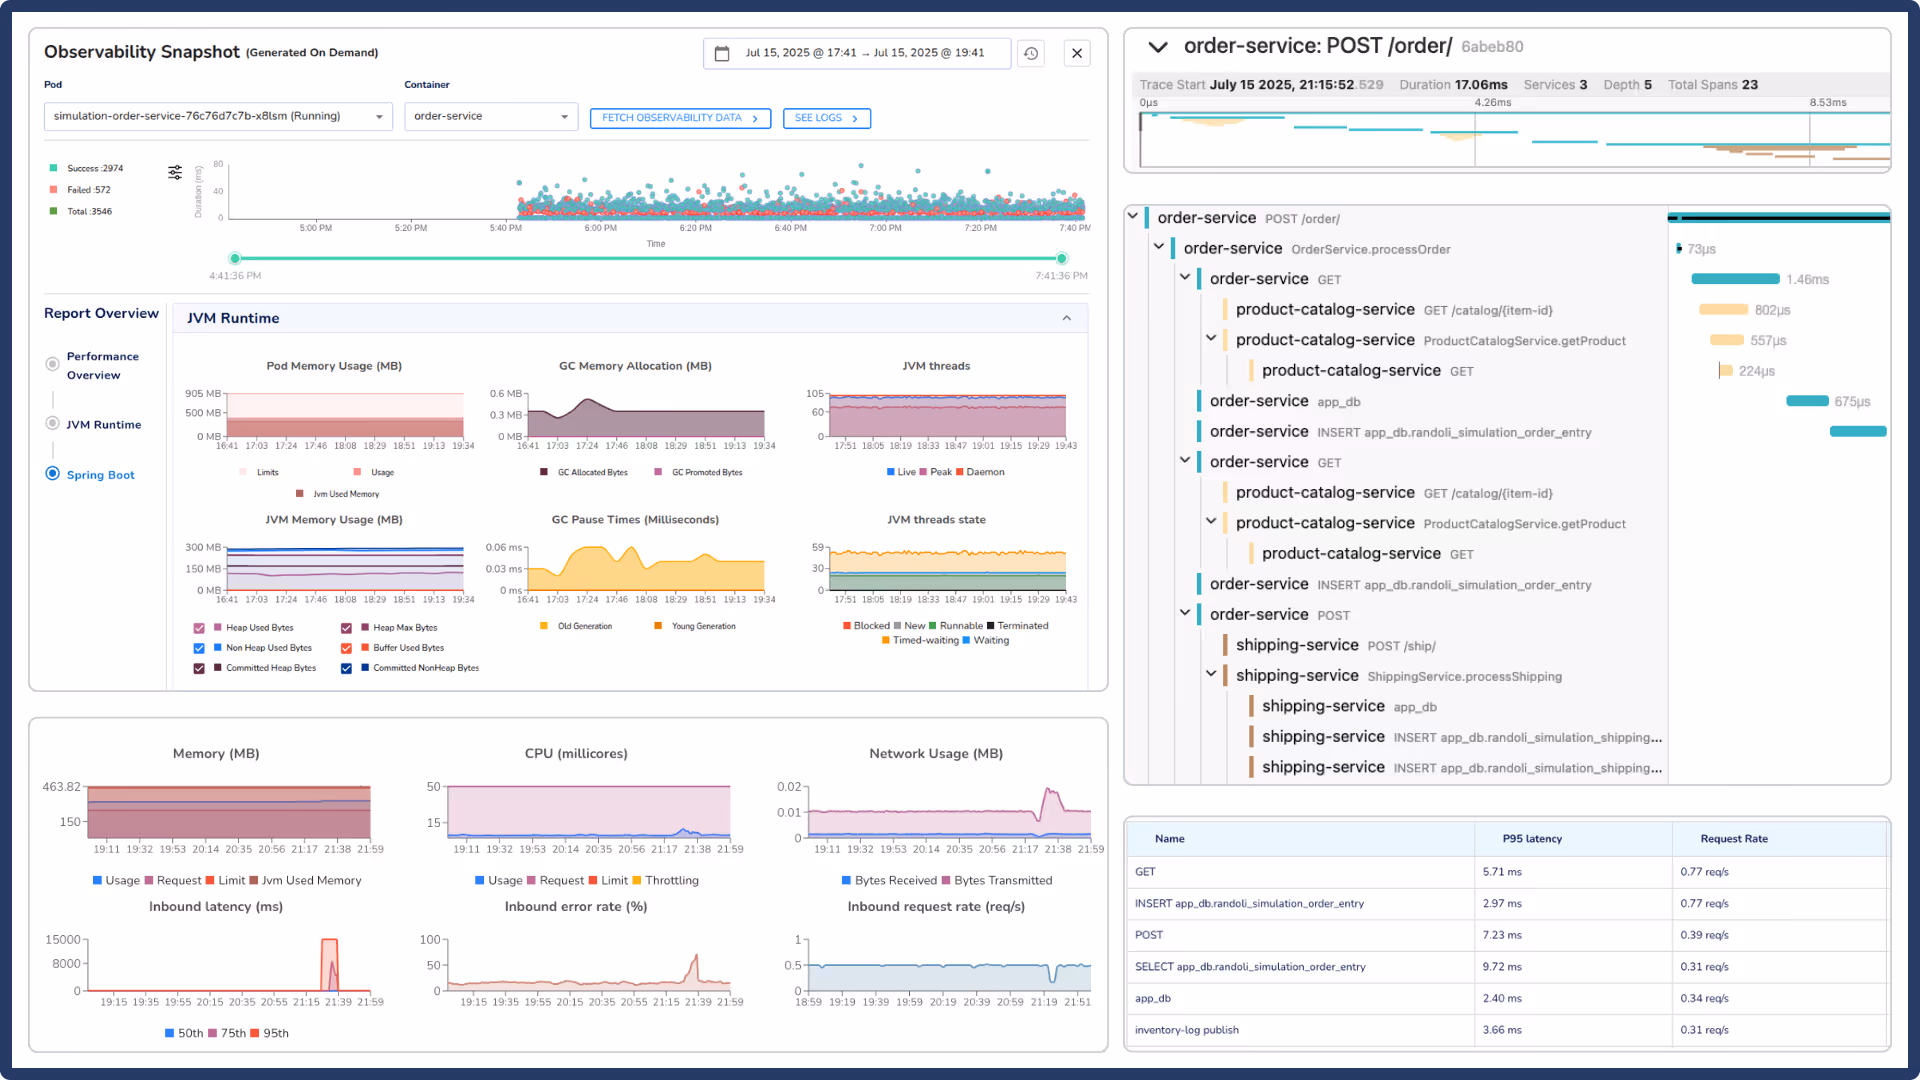
Detect and troubleshoot application issues faster with OpenTelemetry-powered, on-demand telemetry collection.
Aggregate metrics, traces and logs across layers
Capture workload telemetry on demand, during an incident
Track latency, errors, and throughput with built-in monitors
Analyze logs locally to cut egress costs, detect recurring issues in real time, and accelerate resolution.
Avoid vendor lock-in and egress costs with local processing
Identify recurring patterns automatically, without retrospective analysis
Automatically link detected issues to context-rich runbooks
At Randoli, our customers are our number one priority. We collaborate with our customers & open source communities to find innovative solutions to pain points and challenges. This is the secret behind the success of our Observability & Cost Management solutions.